When I first heard about “Constrained Regression”, I was perplexed as to why would someone want to constrain the coefficients which give you the optimal estimates for your data? Well, it turns out to be one of the quintessential aspects of Market Mix Modeling (MMM), especially in Retail and CPG industries. I have divided the article into two sections:
1. Why do we need Constrained Regression?
2. Methods for performing Constrained Regression
Why do we need Constrained regression?
For a practical application, we turn MMM, where it helps in quantifying the impact of various marketing factors on sales or volume share. These marketing factors comprise 4Ps of marketing i.e., Price, Promotion, Product and Place.
There are “What-If “scenarios that emerge here – If I increase the price of a product what happens to sales? If I run a specific promotion how will it impact sales? It turns out, Price and Promotion are easily quantifiable whilst Product and Place might need Mixed models.
Performing a Multiple Linear Regression with Sales as dependent variable and the Ps as our independent variables can easily help you to find the corresponding coefficients, which quantifies the impact of the respective factors.
There’s a lot more to this – As Data Scientists, we also consider the non-linearity in the variables, lag effect, ad stock and saturation, decomposition of sales into base and incremental, price elasticities, volume due-to etc., and since this article is not about dwelling into MMM, I wouldn’t go there for now.
Let’s say we are modelling some retail data with Sales as dependent variable and Price of one of the products as one of the independent variables among few others. The equation would be as below,
Sales= β_0+β_1*Price1+⋯
What does β_1 tell you? A unit change in Price will cause an increase of β_1 in Sales. Well ideally, I would want to know the percentage change in Sales caused due to a percentage change in Price which is nothing but elasticity. For that we need to log transform the Sales and Price variables and perform the regression which essentially equates β_1 to the price elasticity of the demand.
ln(Sales)= β_0+β_1*ln(Price1)+⋯
After modelling the data, we might get some undesirable β_1, which might not be in concordance with your hypothesis. For example, if β_1is between -1 and 1(exclusive) that means the product is inelastic which is counter intuitive if you know for sure that the product is elastic. In thesecircumstances, we might be forced to put some linear constraints on such kind of estimates to align with business scenarios.This can be achieved using Constrained Regression.
DIFFERENT METHODS FOR CONSTRAINED REGRESSION
Quadratic Programming:

Source: https://en.wikipedia.org/wiki/Quadratic_programming
The cost function of OLS can easily be transformed into the above equation and QP can thus be applied to solve with linear equality and inequality constraints.
Bayesian Linear Regression:
If we are constraining some coefficients, that means we have some prior knowledge on the estimates, which is what Bayesian Statistics deals with. We can specify a prior distribution on the estimates and perform the Bayesian regression to get the desired results.
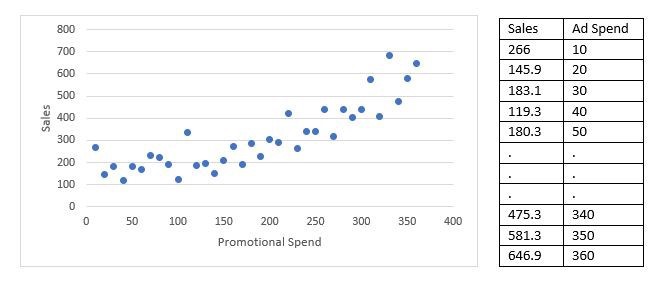
Let’s consider some hypothetical data with Sales and Promotional spend as below.

Source: https://www.kaggle.com/djokester/sales-of-shampoo-over-a-three-year-period (modified)
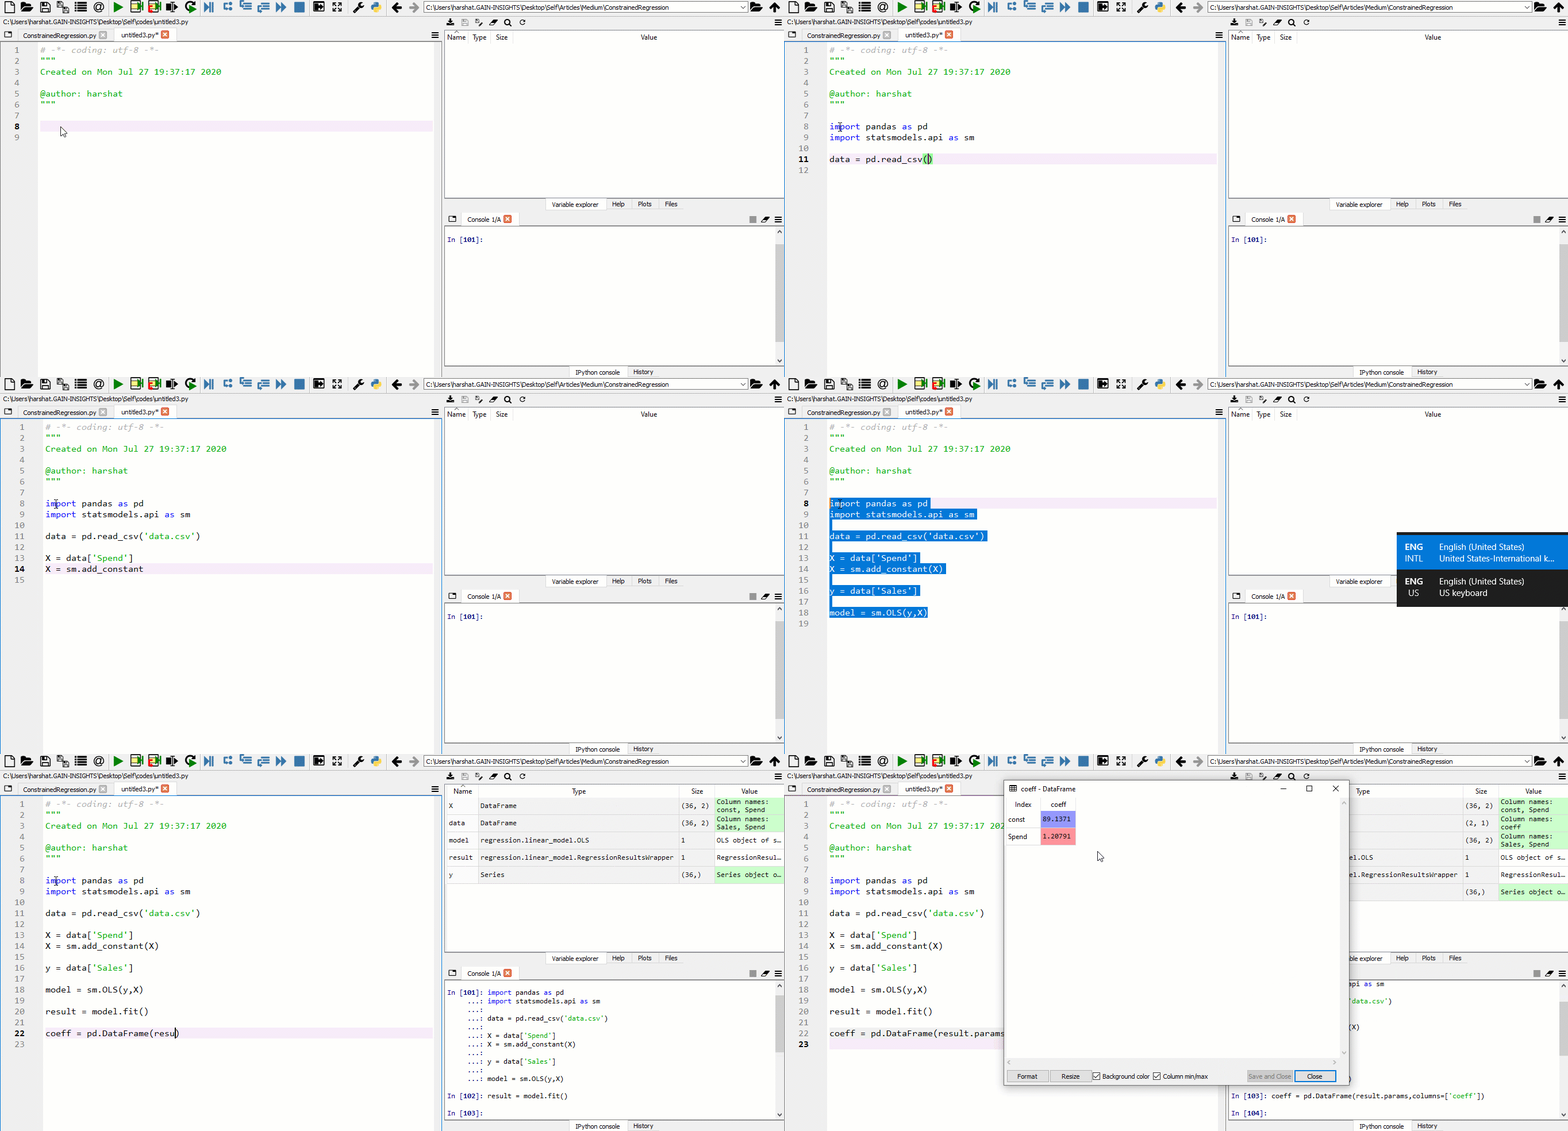
Let us perform Ordinary least squares and see what the results are.

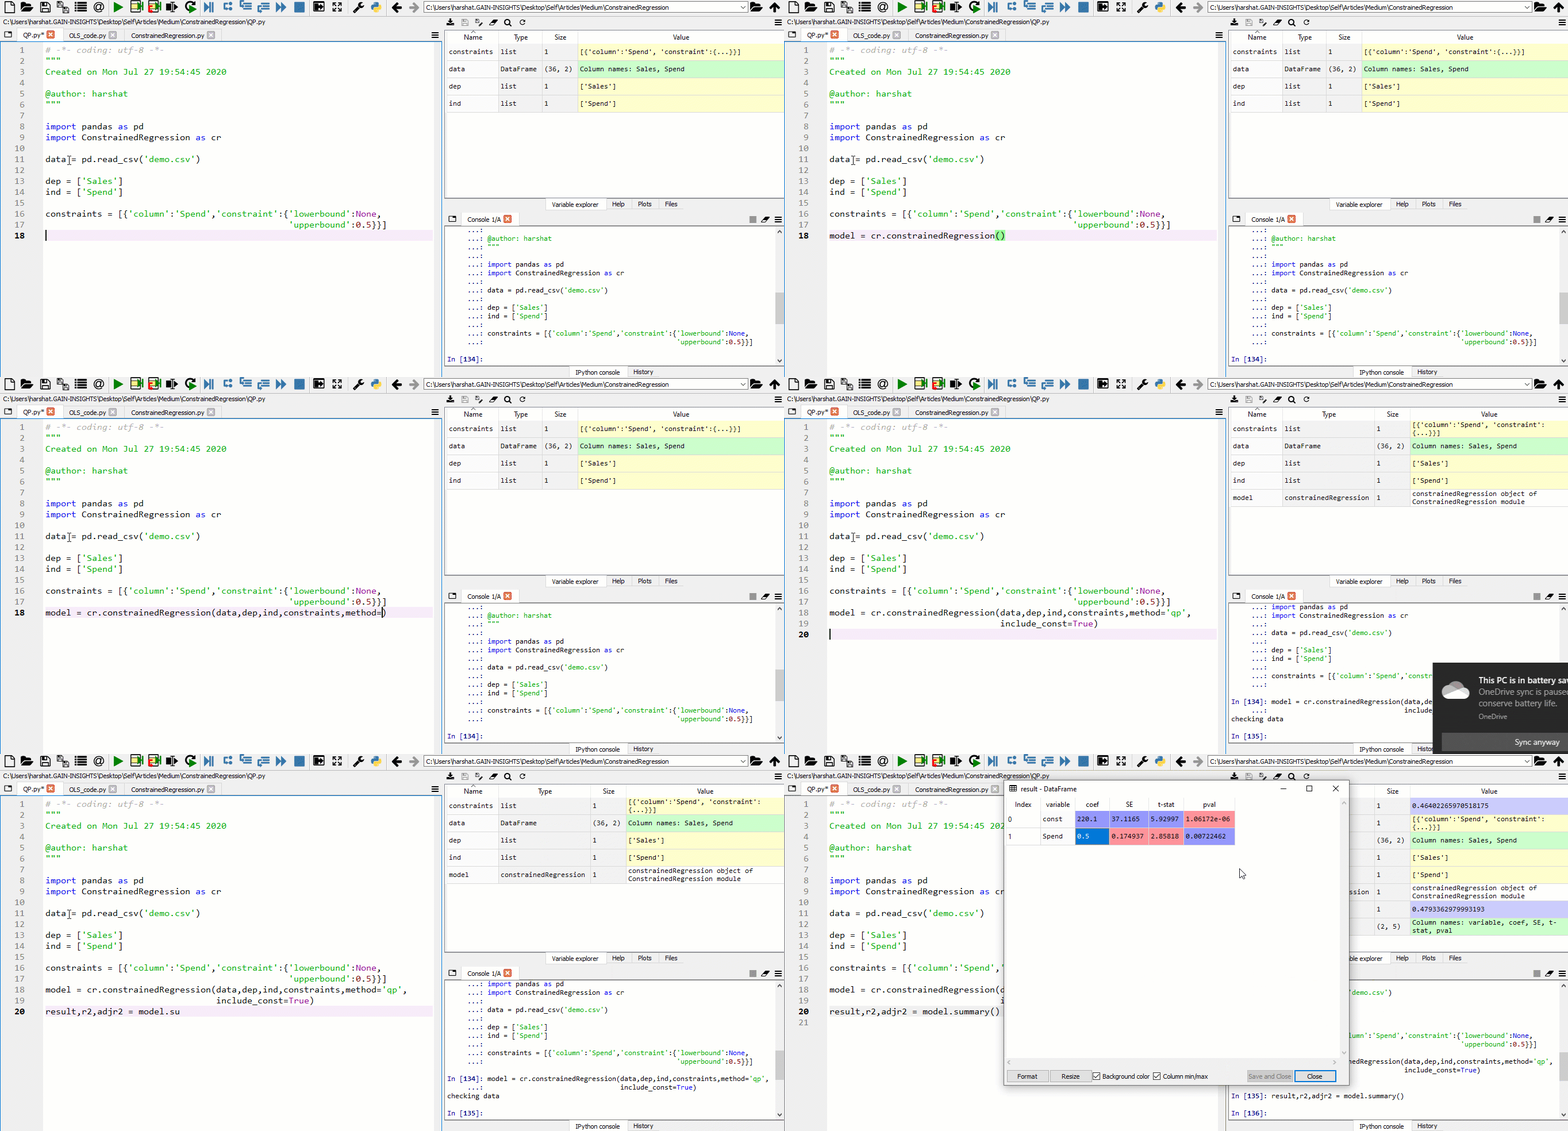
Let us constrain the coefficient of “Spend” to an arbitrary upper bound, say 0.5?

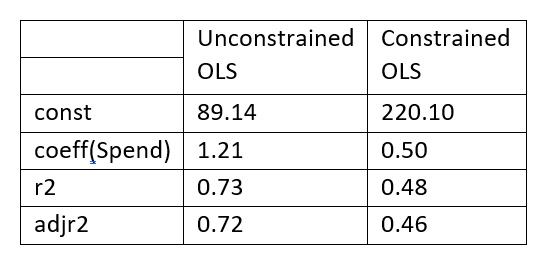
Comparing the results in a tabular format as below,

Constraining the coefficient has cost us too much in terms of r2. And the package used above for constrained regression is a custom library made for a Marketing Mix Model solution for Consumer Packaged Goods (CPG).This custom library coupled with Bayesian Optimization, fuels our ingenious and advanced AI tool for maximizing ROI and simulating Sales. Feel free to get in touch with our team for a brief demo.
Author

Harsha Vardhan
Data Scientist


